By Ron Raymond – Professional Sports Handicapper & Founder of ATS STATS
Experienced sports bettors, have you ever felt like you’re almost there—grinding every day, armed with stats and trends—yet consistent success stays just out of reach? Don’t worry, you’re not alone, and today we’re going to change that. In my 20+ years in the industry (Ron Raymond | Sports Betting Stats), I’ve learned that winning long-term isn’t about simply finding the perfect system or a magic stat. It’s about developing a dual mindset in your handicapping. Some days you need to be an analytics guru, riding with the data and “chalk” (the favorites). Other days you need to channel your inner contrarian, what I call situational handicapping – seeking value on those live underdogs ready to roar.
Like a great Phil Collins drum solo or a roaring Led Zeppelin guitar riff, successful betting is all about timing and feel. You must know when to play it by the numbers and when to improvise and go with your gut. In this article, I’ll show you how to read the sports betting market like a rock anthem—building anticipation with analytics-driven insight and then hitting the big crescendo by spotting situational opportunities. By the end, you’ll understand how to identify if it’s a “favorites/fundamentals” kind of day or an “underdog/value” kind of day before you place your bets. Let’s open your mind to a new way of thinking about sports betting, the same way a classic track can open up your senses.
The Two Types of Betting Days: Analytics-Driven vs. Value-Driven
Every betting day falls into one of two broad categories:
- Analytics-Driven Days (AKA “Chalk Days”): These are the days when everything goes according to plan. Favorites dominate, the stats and trends you’ve crunched point to the right side, and the games play out largely as the analytics predicted. On a chalk day, the betting market behaves in a bullish manner toward favorites – the teams expected to win do win (often by expected margins). If you’re purely a data-driven bettor, these days feel like heaven because the numbers work. You’ll see a lot of green in your spreadsheet and favorites covering the spread… at least the good favorites.
- Situational Handicapping Days (AKA “Value Days”): These are the days when chaos shows up and underdogs have their moments of glory. Upsets happen in bunches, and context trumps pure stats. Maybe a top team is fatigued on a back-to-back, or an underdog is extra motivated by a rivalry or recent slump – whatever the situation, the usual analytics might have steered you wrong if you didn’t consider the intangibles. On a value day, underdogs bite and claim their statistical slice of the pie (historically around 40% of wins come from dogs in many leagues). Bettors who recognize these days can clean up by seizing plus-odds and points with live ’dogs, while those stuck on yesterday’s numbers get blindsided.
Knowing these two modes exist is the first step. The real skill is figuring out which type of day you’re dealing with. Is it time to trust the computer printouts, or time to trust your gut? Let’s dive deeper into each, and how you can tell them apart.
When Favorites Rule: The Analytics-Driven “Chalk” Days
On an analytics-driven day, the stars align for the favorites. You’ll often notice the betting board is filled with strong teams facing weaker opponents, and nothing funky (like major injuries or scheduling disadvantages) is in the mix. These are the days you fire up the ATS STATS database and all the key indicators (win/loss records, offensive/defensive rankings, player matchups) point to the favorites. In my world, I call this “letting the data lead.”
You might ask: “If favorites are so reliable, why am I not winning more?” Here’s a hard truth and a key lesson from the Sports Betting Index (SBI) at ATS STATS: blindly backing favorites still isn’t a golden ticket. Yes, favorites win games outright more often than not, but that doesn’t mean they cover the spread consistently. In fact, the numbers will surprise a lot of people:
NBA Favorites vs. Underdogs (Season %). This chart highlights how frequently favorites win outright vs. cover the spread in the NBA. As shown, favorites win about 67% of games straight-up but cover the point spread only ~45% of the time (How the Market is Moving – Betting Trends & Insights from the Raymond Report SBI (Feb. 13, 2025) | Sports Betting Stats) (How the Market is Moving – Betting Trends & Insights from the Raymond Report SBI (Feb. 13, 2025) | Sports Betting Stats). In other words, the underdogs are losing most games, yet they still cover 55% of the time against the spread. A winning team isn’t always a winning bet – the spread is the great equalizer.
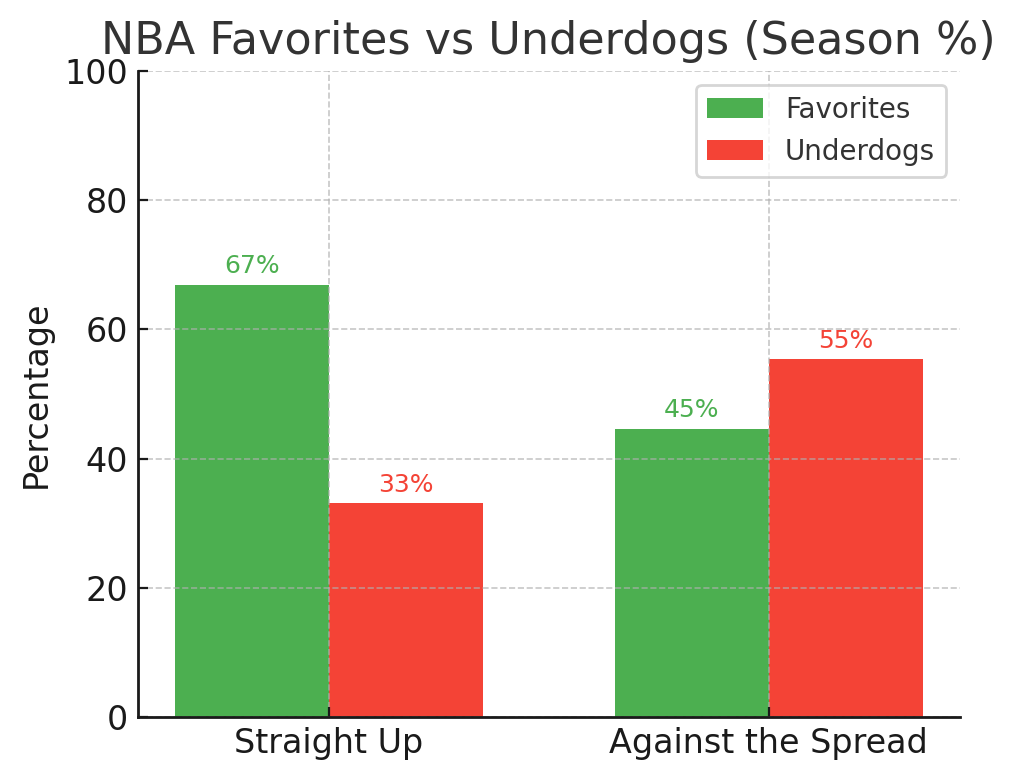
That 67% vs 45% split is the perfect illustration of why you cannot rely on analytics alone. The data may correctly pick the winner (favorites were 66.9% SU this NBA season (NBA Market Pulse Report – February 10, 2025 | Sports Betting Stats)), but the betting value often lies with the underdog getting points. Sportsbooks know the public loves favorites and shade the lines accordingly. So on a pure “analytics” day, you might cash on moneyline bets or parlays with favorites, but be careful laying big points. As I often remind bettors on ATS STATS, a great team can win the game and still lose at the sportsbook.
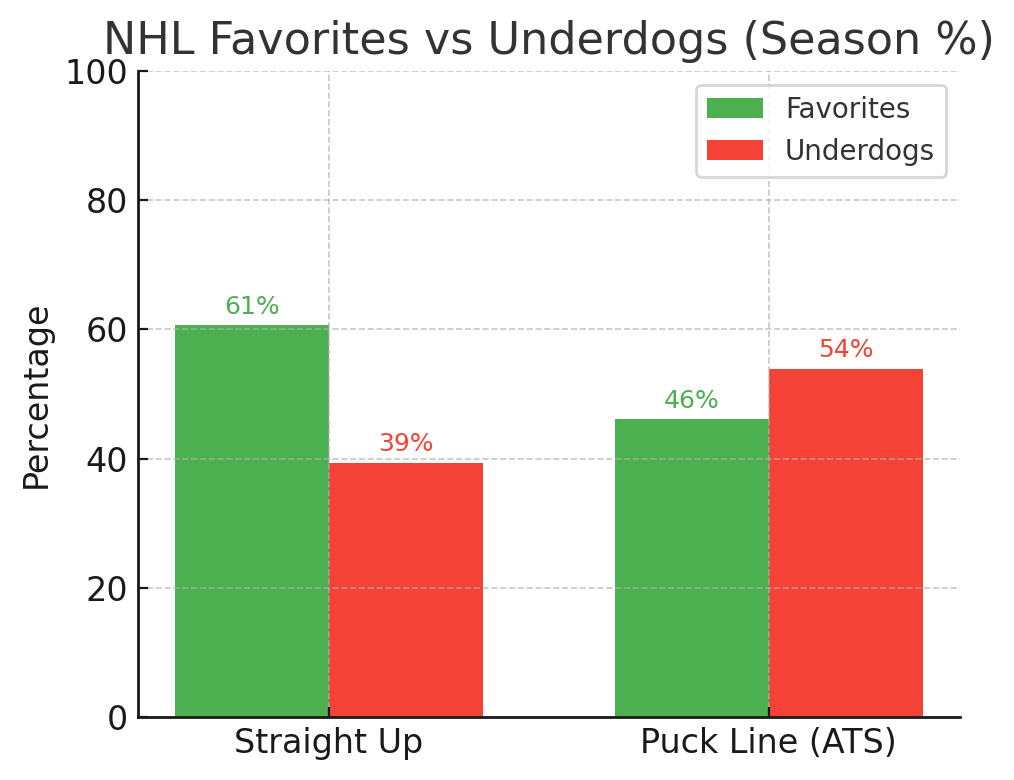
Even in the NHL, where moneyline betting is king, we see a similar story: favorites win ~60% of games, but if you bet them on the puck line (-1.5), they cover less than half the time. The SBI data confirms it – NHL favorites have been winning about 60.6% of games this season (Raymond Report NHL Sports Betting Index: A Season-to-Date Analysis (11/21/24) | Sports Betting Stats), yet they only cover the puck-line spread roughly 46% of the time (Raymond Report NHL Sports Betting Index: A Season-to-Date Analysis (11/21/24) | Sports Betting Stats). That means underdogs getting +1.5 goals (or winning outright) are hitting ~54% of the time. Think about that for a second: the “better” team wins more games, but the underdog bettors still often get the cash.
NHL Favorites vs. Underdogs (Season %). Even in hockey, where favorites tend to win outright more often, they struggle to cover the puck line. This chart shows NHL favorites’ ~61% win rate vs ~46% puck line cover rate (Raymond Report NHL Sports Betting Index: A Season-to-Date Analysis (11/21/24) | Sports Betting Stats) (Raymond Report NHL Sports Betting Index: A Season-to-Date Analysis (11/21/24) | Sports Betting Stats), underscoring that a winning team isn’t automatically a winning bet. Underdogs and puck-line bettors are capitalizing on those close games and empty-net nail-biters.
So what’s the play on analytics-heavy days? First, recognize when you’re in one. If yesterday and the day before saw most favorites cruising (check the SBI “market watch” on ATS STATS – if it’s showing a recent bullish run for favorites, that’s a clue), and today’s slate looks similarly lopsided on paper, it might be a chalk day. On such days, I adjust my strategy accordingly:
- Trust but Verify the Data: I’m more inclined to trust my power ratings, scoring averages, and trend analysis on a chalk day. If all my analytics say Team A should beat Team B handily, and there’s no glaring situational red flag, I’ll lean into that pick with confidence. This is when the Raymond Report fundamentals shine – those A-grade teams with solid analytics are likely to deliver.
- Moneyline Parlays or Teasers with Favorites: Because I know favorites win straight-up far more than they cover ATS, I might pair a few heavy favorites on the moneyline in a parlay instead of laying the points each. For example, if the Lakers, Celtics, and Nuggets are all big favorites in good spots, rather than betting each -10 spread, I’ll parlay their moneylines. They just need to win the game, which they do much more often than not. As the SBI data suggests, this can be smarter on a chalk day (NBA Market Pulse Report – February 10, 2025 | Sports Betting Stats). Alternatively, I could use a teaser to shorten those spreads. The idea is to leverage the favorite’s high win probability without getting burned by a backdoor cover.
- Avoid Forcing Underdogs: A lot of sharp bettors love being contrarian (and I do too, in the right moment), but on a true favorites-dominated day, don’t fight the tape. If everything is screaming that the top teams will roll, and you can’t find a compelling reason otherwise, don’t bet underdogs just because. Remember, even the 45% ATS stat for favorites is an average — on some days favorites cover well above 50%. You want to be on that train when it’s leaving the station. If it looks like a favorites day, play a couple of the best ones, or pass on a game instead of forcing an upset pick with weak reasoning.
- Keep an Eye on Line Inflation: One caveat – even on chalk days, be mindful of inflated lines. Sportsbooks know an analytics-heavy slate will attract public money on favorites. They might pad a spread by an extra point or two. If a spread looks a few points too high (maybe due to a popular team getting public love), you may still find value on the dog in that specific game. For instance, if the data says a team should be -5 but they’re -8 because everyone’s betting them, you’ve identified a potential exception. As I often say on the ATS STATS podcast, the only bad dog is one without bite. If you find a focused underdog catching too many points, it can still be a play – but make sure it has situational merit, not just blind contrarianism.
To sum up chalk days: embrace the favorites, but do it smartly. Ride the teams that are supposed to win, but consider betting them in ways that mitigate the spread-related risks. The analytics are your sheet music on these days – follow the notes, but stay alert for any out-of-tune lines.
When Underdogs Prevail: The Situational “Value” Days
Now let’s talk about those wild days when David knocks out Goliath. We’ve all seen them – maybe it’s a Saturday full of college basketball upsets, or an NFL Sunday where the big favorites fall flat. On these days, situational handicapping takes center stage. This is the art of reading between the lines: travel schedules, emotional letdowns, look-ahead spots, injuries, weather, revenge games, rivalry intensity, you name it. The box score numbers might all point one way, but the context screams for an upset.
How do you spot a value day? Here are a few telltale signs I look for each morning as I sip my coffee and scan the schedule:
- Recent Market Behavior: If the last few days have seen a lot of underdogs covering and winning, the market could be in a bearish phase for favorites. The Raymond Report’s SBI is invaluable here – for example, if over the last 3 days only ~33% of NBA favorites covered (meaning ~67% of dogs covered) (NBA Market Pulse Report – February 10, 2025 | Sports Betting Stats), that’s a big clue that underdog momentum is brewing. It could mean the oddsmakers will adjust or that we’re in a cycle where the dogs are barking loudly. While it can correct at any time, don’t ignore the trend: the 40% slice of underdog wins might be coming due if favorites have been too dominant lately (or vice versa). Think of it like a pendulum swinging.
- Fishy Lines on Strong Teams: Ever see a ranked college team only laying -2 at an unranked opponent? Or an elite NBA team barely favored against a sub-.500 squad? If the line stinks, it’s often for a reason. These are the games where casual bettors go “Huh? Only -2? Hammer it.” and then they get burned when the underdog wins outright. Oddsmakers set traps when they sense a situational edge favoring the dog. As an experienced bettor, you need to sniff these out too. If it looks too good to be true on paper, it probably is.
- Scheduling and Fatigue Spots: This is classic situational capping. Maybe a powerhouse team is on their third road game in four nights, or they played a double-overtime thriller yesterday. Fatigue kills favorite’s edges. The analytics from season averages won’t account for dead legs or a likely “take it easy” approach from a coach. Similarly, a team coming off a huge emotional win (say, a playoff-clinching victory or a big rivalry game) might be ripe for a letdown in their next outing against a supposedly weaker opponent. I love targeting those letdown spots and backing the hungrier underdog. The data won’t tell you the favorite is running on fumes or mentally drained, but your situational awareness will.
- Public Perception vs. Reality: Upset days often catch the public off-guard, but if you’re tuned in, you can be on the right side of public misinformation. For example, if a star player is announced as questionable or out, the public might dump their support, causing the line to move dramatically. But sometimes the rest of the team steps up (we’ve all seen the “star player out, everyone else rallies” phenomenon). If you, as a sharp bettor, know a team can still compete without their star (or if the line move was too extreme), there’s value. Injuries, weather, off-field news – anything that skews public opinion heavily can create value on the other side once you analyze the true impact calmly.
So, say you’ve determined it’s shaping up to be a value day – underdogs look juicy across the board. What’s the game plan? Here’s how to capitalize:
- Identify Live Underdogs: Not all underdogs are created equal. You want the ones with a legit shot to win or keep it close. Look for underdogs with strong defenses (defense can level the playing field), good coaching (capable of game-planning to neutralize a favorite’s strength), or a situational edge like extra rest or motivation. In the NHL, this could mean a team with a hot goalie or a recent spark in offense going up against a favorite in a tough scheduling spot – that dog has bite (Raymond Report NHL Sports Betting Index: A Season-to-Date Analysis (11/21/24) | Sports Betting Stats). In the NBA, it could be a young, hungry team catching an older contender on a 5-games-in-7-nights stretch. Circle those games. These are your upset candidates.
- Sprinkle the Moneylines, Grab the Points: On value days, I’ll often split my bet on an underdog game: half against the spread (to grab the points as insurance) and half on the moneyline for the big payoff. For example, if the underdog is +6, I might put half a unit on +6 and half a unit on the +200 moneyline. If they cover, great – if they win outright, cha-ching! Because on these days, you’ll see some of those dogs not just covering but winning straight up. Historically, underdogs win outright roughly 30-40% of the time (depending on the sport), but on certain nights that number shoots up. Those are the nights that build your bankroll if you’ve got a piece of those MLs. (And let’s be honest, nothing feels better than cashing an underdog ticket that everyone else doubted.)
- Leverage SBI Data for Totals Too: While our focus is sides, don’t forget that some days are “over” days and some are “under” days. The SBI charts on ATS STATS also track Overs/Unders, and often there’s a situational angle there. Maybe referees are calling games tight leading to lots of free throws (over-friendly), or a weather system is impacting multiple NFL games (under-friendly). Recently, NBA games have seen about 53% of games go Over the total (season average) (NBA Market Pulse Report – February 10, 2025 | Sports Betting Stats), but that can swing wildly day-to-day. If you sense a slate-wide trend – say, a bunch of tired teams (which often means slower pace, good for unders) – you might adjust your totals betting for a value edge. The key is the same: determine if the day’s conditions favor the expected outcome or an alternate one, and bet accordingly.
- Stay Flexible and Don’t Marry Your Pre-game Bias: On value days especially, be ready to live bet or hedge if you see the games unfolding differently. Maybe one favorite looks surprisingly sharp despite the situational disadvantages – you might ease off your position against them. Conversely, if an underdog you liked falls behind early, watch the game flow: are they just cold shooting or getting unlucky? If yes, a live bet at an even better line could be in order. Being nimble is part of the situational bettor’s toolkit. Because you’re trading on volatility and uncertainty, you have to manage risk in real-time sometimes.
One more crucial point: even on underdog-heavy days, don’t abandon all logic. It’s easy to get carried away and start betting every longshot in sight. Successful handicappers still pick their spots. Maybe it’s a 8-game NBA night and you sense a dog day – it doesn’t mean 7 of 8 dogs will cover. It might be 5 of 8. Your job is to figure out the best 5, not blindly bet all 8. This is where combining analytics with intuition is so powerful. Use your models and numbers to narrow down which underdogs have statistical arguments in their favor too (e.g., a solid rebounding team getting points against a poor rebounding favorite). Those are the underdogs most likely to come through. It’s the fusion of form (analytics) and feeling (situation) that makes the difference.
The Sports Betting Index (SBI): Your Market Barometer
You’ve heard me mention the SBI a few times. It’s not just jargon – it’s my go-to tool on ATSstats.com for gauging what I call the “Market Weather.” Think of the SBI as the sports bettor’s weather report: Are we in a high-pressure system favoring favorites, or is there a storm brewing for underdogs? The Sports Betting Index (SBI) tracks how favorites vs. underdogs (and overs vs. unders) have been performing recently and over the season (How the Market is Moving – Betting Trends & Insights from the Raymond Report SBI (Feb. 13, 2025) | Sports Betting Stats). It’s like a stock market chart for betting results – it shows when the “market” is bullish, neutral, or bearish on favorites.
For example, an SBI reading might tell us Favorites are 67% SU on the season (bullish) but only 45% ATS (bearish) (How the Market is Moving – Betting Trends & Insights from the Raymond Report SBI (Feb. 13, 2025) | Sports Betting Stats) (How the Market is Moving – Betting Trends & Insights from the Raymond Report SBI (Feb. 13, 2025) | Sports Betting Stats) – exactly the scenario we discussed. It might show that in the last 7 days, underdogs covered, say, 62% of games (indicating a strong short-term move towards dogs) (NBA Market Pulse Report – February 10, 2025 | Sports Betting Stats). Or perhaps overs hit 60% this week (bullish for overs) before cooling off last night. By glancing at these charts, I can quickly get a feel for momentum shifts. If I see a big swing, I ask “Is this trend likely to continue today, or revert?”
Using the SBI data alongside your own handicapping is a game-changer. It prevents you from betting in yesterday’s shadow. If the SBI shows an unusual pattern (e.g., favorites have covered an abnormally high percentage last few days), it might be time to anticipate a regression and lean more value plays today. Conversely, if favorites have been underperforming ATS for a week, maybe they’re due for a course correction – perhaps a chalky day is ahead. The SBI is updated daily on our ATS STATS website, so you can incorporate those insights into your morning routine. Consider it your market dashboard; just as a driver wouldn’t start a long trip without checking the weather and fuel gauge, you shouldn’t place bets without checking the market temperature.
To illustrate the current landscape, here’s a quick snapshot of the recent SBI stats for the NBA and NHL:
Table 1: NBA & NHL Betting Market Summary (Season-to-Date)
| League | Favorites SU Win% | Underdogs SU Win% | Favorites ATS Cover% | Underdogs ATS Cover% | Overs % | Unders % |
|---|
| NBA | 67% | 33% | 45% | 55% | 53% | 47% |
| NHL | 61% | 39% | 46% | 54% | 49% | 51% |
Data Source: ATS STATS Sports Betting Index (SBI) – Favorites vs. Underdogs straight-up (SU) and against the spread (ATS), plus Over/Under splits. Percentages are rounded.
Look at those numbers. They tell a story: In both NBA and NHL, the favorites have a strong SU record, but underdogs hold their own ATS. NBA favorites win roughly 2 out of 3 games straight-up, yet underdogs cover more often than favorites against the spread. NHL favorites win about 60%, but puck-line dogs cash more than puck-line favorites. And totals are hovering near 50/50 (slightly over in NBA, slightly under in NHL), reminding us how efficiently the bookmakers balance the O/U lines. This table is a cold shower for anyone betting blind favorites or blindly following “overs are hitting lately!” without context. We need to dig deeper every day.
Trust the Process and Stay Versatile – You’ve Got This!
By now, you might be thinking, “This is a lot to process – analytics, situational angles, market trends… can I really juggle all this?” The answer is YES – and in fact, you might find it becomes second nature with practice. The key is to trust the process and embrace the idea that you are not just a stats geek or just a gut player – you’re both. Some days you’ll lean more heavily on one side, but having that dual toolkit is what separates the consistent winners from the “almost” guys.
Remember, every successful bettor I know (and I’ve mentored many through ATS STATS) has gone through this evolution. Early on, I was a pure numbers guy – I’d crunch team stats and betting trends for hours. I enjoyed some wins on obvious spots, but I’d get clobbered on nights where, say, a big underdog came out of nowhere. So I swung the other way – tried being Mr. Contrarian on everything. And guess what? I’d pick the wrong spots to be contrarian and lose when favorites rolled as expected. It wasn’t until I married the two approaches that my win rate and consistency took off. It’s like tuning a guitar – you need the high notes and the low notes in harmony. Pure analytics is one note; pure instinct is another. The sweet spot is the chord they form together.
So, as you step into each betting day, take a moment to assess: What kind of day is this? Is it one where the data (team stats, power ratings, trends) is king? Or one where context (situation, motivation, schedule) will rule? Some days it’s obvious, some days it’s a bit of both. But approaching your bets with this question will put you ahead of the curve. You’ll start catching things like, “Sure, Team X is statistically superior – but this is their 5th game in 8 nights, maybe I should be cautious or even look at Team Y.” Or conversely, “Everyone’s talking upset, but all situational factors aside, Team A is just too fundamentally sound to falter tonight.”
One final piece of inspiration: stay positive and keep learning. Betting, like any craft, has its ups and downs. Even when you adopt the dual mindset, you will still have losing days – that’s just part of the game. But in the long run, this flexible approach will sharpen your edge. You’ll start to feel like you have the sportsbook “dialed in” because you’re no longer one-dimensional. When the market zigs, you’re ready to zag. When the public sleeps on an angle, you’re wide awake. This is empowering stuff!
At ATS STATS, we have a saying: “Scared money don’t make money, and blind money don’t keep money.” It means you have to be bold but also smart. Using both analytics and situational insight is how you stay bold and smart. You’re essentially covering all your bases – if the game goes by the book, you’ve got that side covered; if it goes off-script, you spotted the plot twist.
In the end, the goal is to make consistent, sound decisions and let the results follow. Some days you’ll hit a home run, other days you’ll grind out a small profit or a small loss. But consistency builds bankrolls. So next time you’re about to place a bet, pause and ask: “Am I betting into an analytics day or a value day?” Make that your routine. Over time, you’ll gain a sixth sense for it.
Now, go forth and put this into practice. Crank up that Phil Collins or Led Zeppelin track if it gets you in the zone – you’ve got the knowledge, you’ve got the experience, and now you’ve got the dual mindset to tie it all together. Today is a new day on the betting calendar. Chalk or dogs, over or under – you’re ready to conquer it all. Trust the process, keep your mind open, and let’s sharpen that betting edge. The next level of success is waiting for you, and I’ll see you at the cash window! 🎯🏆
