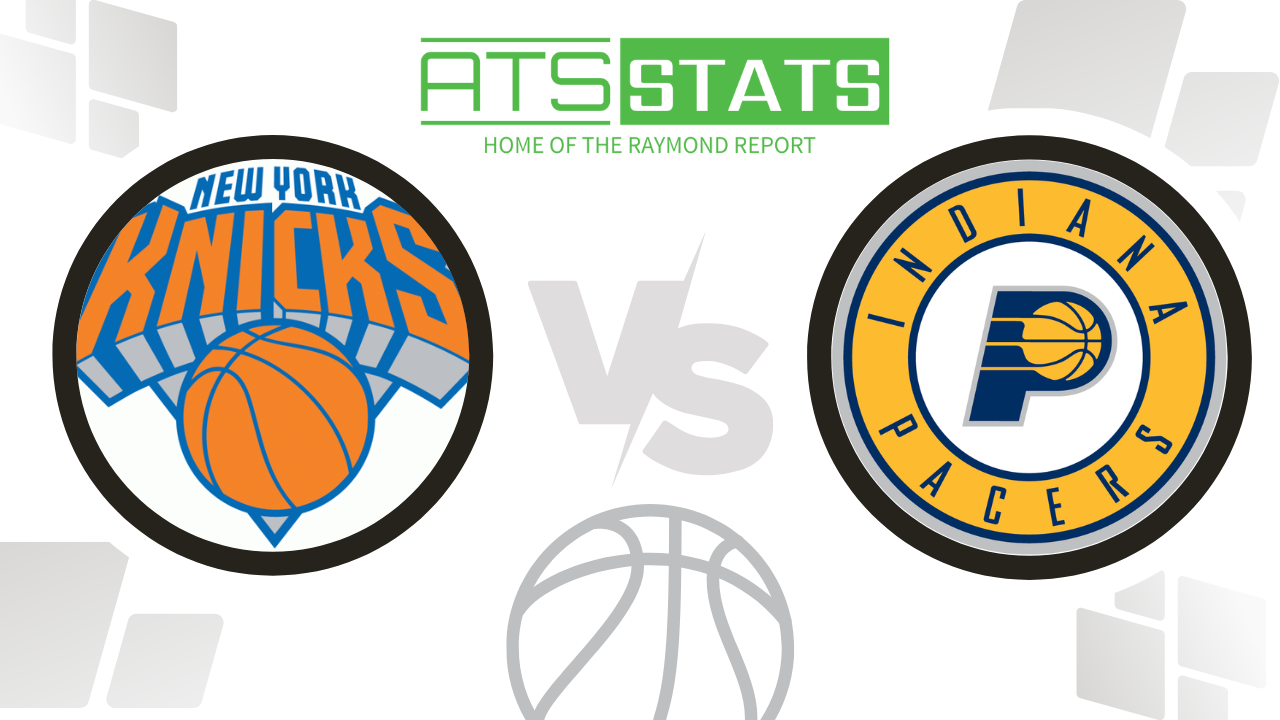
Here’s your NBA Market Pulse Report for New York Knicks vs. Indiana Pacers using the Raymond Report SBI Charts.
NBA Market Pulse Report – February 11, 2025
New York Knicks (-2.5) vs. Indiana Pacers (+2.5, Total: 239.5)
The Raymond Report SBI Charts provide valuable insight into market trends, betting edges, and where the value lies in today’s NBA matchups. Tonight’s game between the New York Knicks and Indiana Pacers features a high total and a tight spread, making it a prime matchup for market analysis.
🔥 SU (Straight Up) Market Trends – Favorites vs. Underdogs 🔥
✅ Favorites are cashing at 66.9% on the season, maintaining a strong bullish trend.
📈 Recent Trends:
- Last 7 Days: 57.7% Favorites (Bullish) – Slight dip, meaning underdogs have been more competitive recently.
- Last 3 Days: 67% Favorites (Bullish) – Closer to the season-long trend favoring favorites.
- Last 1 Day: 67% Favorites (Bullish) – Chalk continues to dominate.
🔹 Takeaway: Favorites have continued winning outright, which supports New York in this spot. However, Indiana is playing at home, and their 14-8 SU home record suggests they’re a formidable opponent.
📊 ATS (Against the Spread) – Who’s Covering?
📉 ATS Favorites: 44.6% (Bearish to Neutral Market)
📈 ATS Underdogs: 55.5% (Bullish to Neutral Market)
Recent Trends:
- Last 7 Days: 37.9% Favorites, 62.1% Underdogs (Bearish for Favorites)
- Last 3 Days: 38.3% Favorites, 61.7% Underdogs (Bearish for Favorites)
- Last 1 Day: 33% Favorites, 67% Underdogs (Very Bearish for Favorites)
🔹 Takeaway: Despite winning outright, favorites have been struggling to cover the spread. Indiana has been inconsistent ATS at home (9-13), while the Knicks are 11-13 ATS on the road. This is a tough ATS call, but market trends lean toward the Pacers covering as a home underdog.
💰 O/U Market – Are Overs or Unders Dominating?
📈 Season-to-Date: 53% Overs vs. 47% Unders (Neutral Market)
Recent Trends:
- Last 7 Days: 60.3% Overs (Bullish Market for Overs)
- Last 3 Days: 51.7% Overs (Neutral Market)
- Last 1 Day: 33% Overs (Bearish Market for Overs)
🔹 Takeaway: The season has been slightly favoring overs, but recent trends show some slowdown. The total is set at 239.5, a very high number, and both teams have trended toward the over in their recent matchups (6-4 O/U in L10G).
🔹 Betting Edge: The Knicks and Pacers have combined for 230.58 projected points based on the Raymond Report, which is almost 10 points under the current total. This suggests potential value on the UNDER.
📌 Key Betting Angles for New York vs. Indiana
📌 Knicks as a Road Favorite: New York is 16-8 SU on the road but only 11-13 ATS, meaning they win but don’t always cover.
📌 Pacers’ Home Performance: Indiana is 14-8 SU at home but just 9-13 ATS, making them unreliable in spread betting.
📌 ATS Market Favors Underdogs Covering: With 62.1% of underdogs covering in the last 7 days, and favorites struggling ATS, Indiana +2.5 looks like the sharper ATS play.
📌 Over Trend Slowing Down: While overs have been hitting, yesterday saw a shift toward unders, making the under 239.5 a potential value play.
🔑 Get the Full NBA Betting Breakdown Inside the Raymond Report!
💡 Want to stay ahead of the market? The Raymond Report SBI Charts give you:
✔ Daily Betting Trends & Market Insights
✔ ATS & Total Betting Indicators
✔ Exclusive Raymond Report Data for Every NBA Game
👉 Don’t miss out—get full access to the Raymond Report now!
🔗 Click Here to Become a Member
Final Thoughts:
- Knicks are the better team overall, but ATS trends favor the Pacers covering.
- The market is adjusting on totals, and the under 239.5 could be a value spot.
- If betting ATS, Indiana +2.5 has the stronger market edge.

