As we dive into the heart of the 2024 MLB season in the middle of August, teams are jockeying for playoff positions, making every win crucial. Let’s analyze the standout performers and those who struggled over the past month in both straight-up wins and Over/Under trends.
Straight-Up Wins and Losses
The MLB landscape has been intriguing, with some teams asserting dominance while others face challenges. Here’s a breakdown of the performance by division and team:
Division Performance
- NL West: Dominating with a record of 78 Wins – 49 Losses, the NL West leads all divisions with a 61.42% win rate.
- AL West: A solid showing with 67 Wins – 59 Losses, translating to a 53.17% win rate.
- NL Central: Keeping it competitive with a 51.59% win rate through 65 Wins – 61 Losses.
- AL East: Slightly below .500 at 63 Wins – 65 Losses, resulting in a 49.22% win rate.
- NL East: Struggling with a 43.94% win rate at 58 Wins – 74 Losses.
- AL Central: Facing challenges with a 40.8% win rate through 51 Wins – 74 Losses.
Individual Team Highlights
- Top Performers:
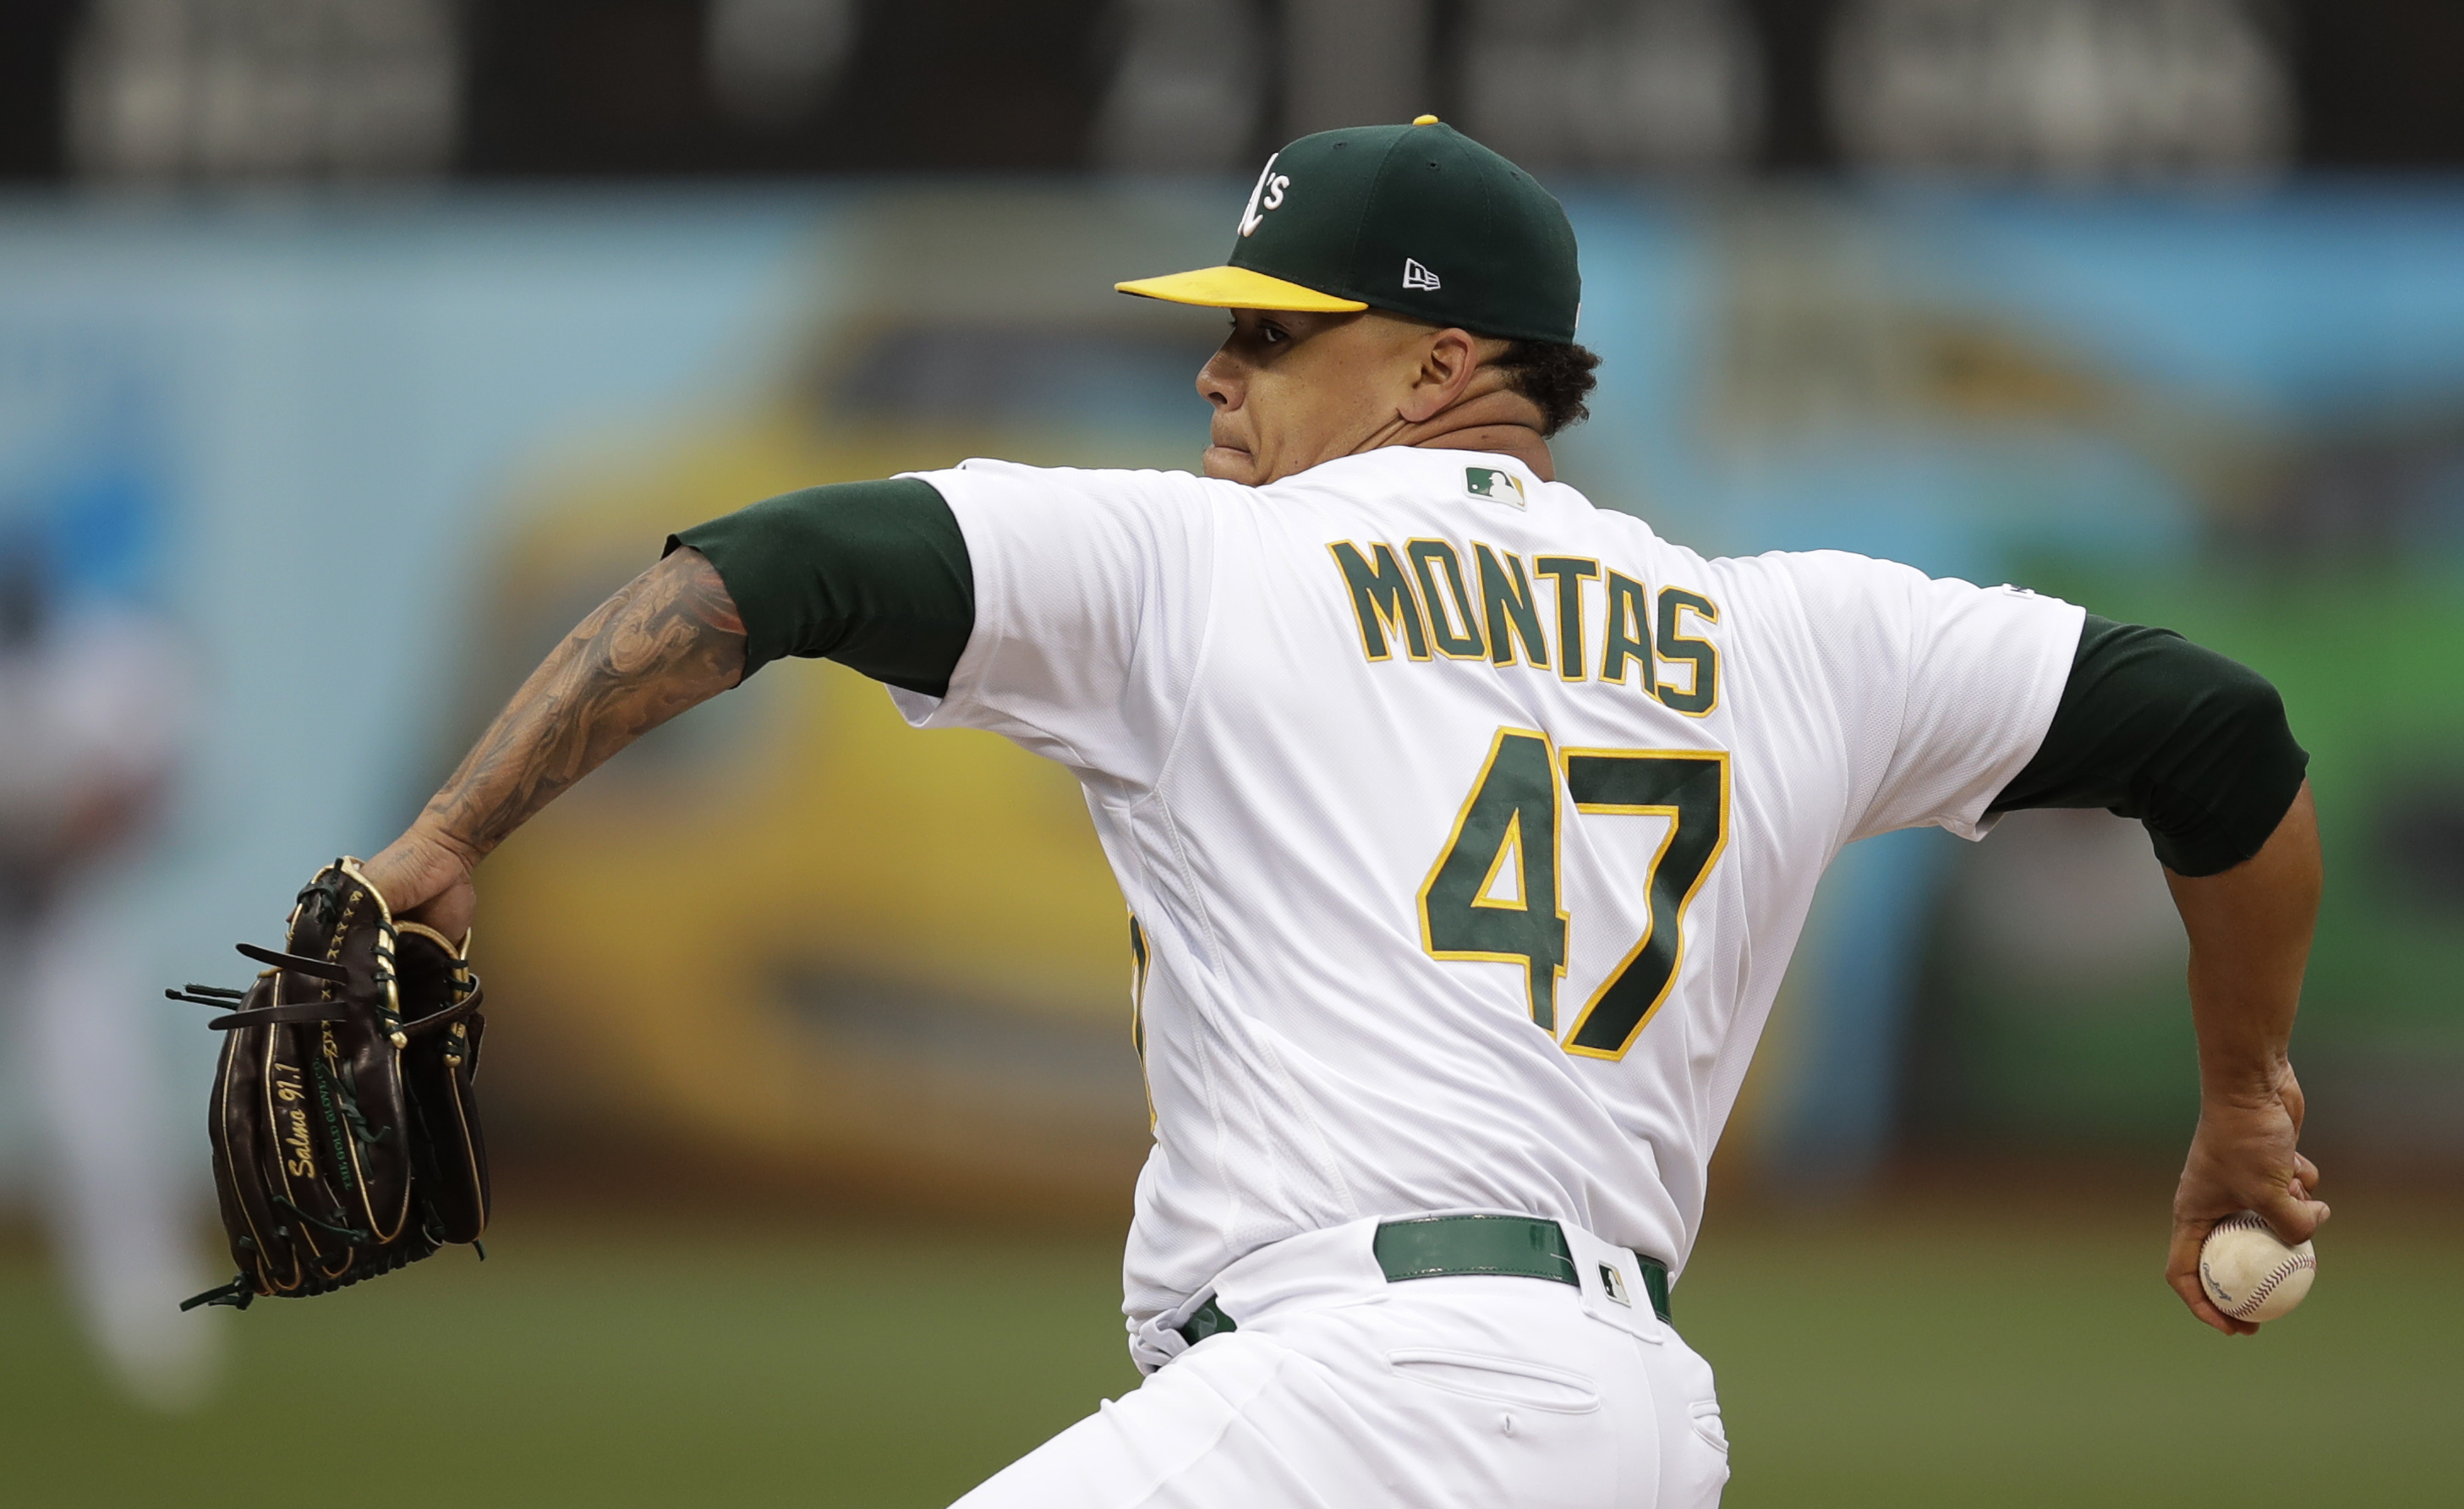
- Oakland Athletics: Leading the charge with 15 Wins – 10 Losses, boasting a 60% win rate.
- Chicago Cubs: Close behind with a 57.69% win rate from 15 Wins – 11 Losses.
- Tampa Bay Rays: Impressive at 14 Wins – 11 Losses, maintaining a 56% win rate.
- New York Mets: Strong at 15 Wins – 12 Losses, achieving a 55.56% win rate.
- Struggling Teams:
- Chicago White Sox: Enduring a tough stretch at 1 Win – 23 Losses, with a 4.17% win rate.
- Philadelphia Phillies: Battling with a 34.62% win rate from 9 Wins – 17 Losses.
Over/Under Records
Over/Under betting trends reveal fascinating insights into teams’ offensive and defensive performances:
Division Performance
- AL East: Dominating the Over category with 82 Overs – 41 Unders – 5 Ties, a 66.67% Over rate.
- NL East: Following with 73 Overs – 57 Unders – 2 Ties, achieving a 56.15% Over rate.
- NL West: Consistent with 69 Overs – 55 Unders – 3 Ties, a 55.65% Over rate.
- NL Central: Competitive with a 54.55% Over rate at 66 Overs – 55 Unders – 5 Ties.
- AL West: Balancing with 62 Overs – 58 Unders – 6 Ties, resulting in a 51.67% Over rate.
- AL Central: Even split with 60 Overs – 60 Unders – 5 Ties, at a 50% Over rate.
Team Highlights
- Top Over Performers:
- Toronto Blue Jays: Leading with a 79.17% Over rate at 19 Overs – 5 Unders – 2 Ties.
- New York Yankees: Strong with a 75% Over rate at 18 Overs – 6 Unders – 1 Tie.
- Baltimore Orioles: High Over rate of 73.08% from 19 Overs – 7 Unders – 1 Tie.
- Miami Marlins: Impressive with a 70.37% Over rate at 19 Overs – 8 Unders.
- Low Over Performers:
- Tampa Bay Rays: Defensive with a 37.5% Over rate at 9 Overs – 15 Unders – 1 Tie.
- Chicago White Sox: Balanced at 43.48% Over rate with 10 Overs – 13 Unders – 1 Tie.
Ron’s Summary
As the MLB season progresses, these insights into team performances can offer valuable betting angles. Whether you’re looking at straight-up wins or Over/Under trends, understanding these dynamics can help you make more informed bets. Keep an eye on these trends as we move closer to the postseason!


